Geological Image
Analysis Software - GIAS v2
Screenshots
The following screenshots show results from an
image of vesicles from a sample of basalt from Laki eruption (Iceland),
courtesy of Dr. Emma Passmore (Nat. Hist. Museum).
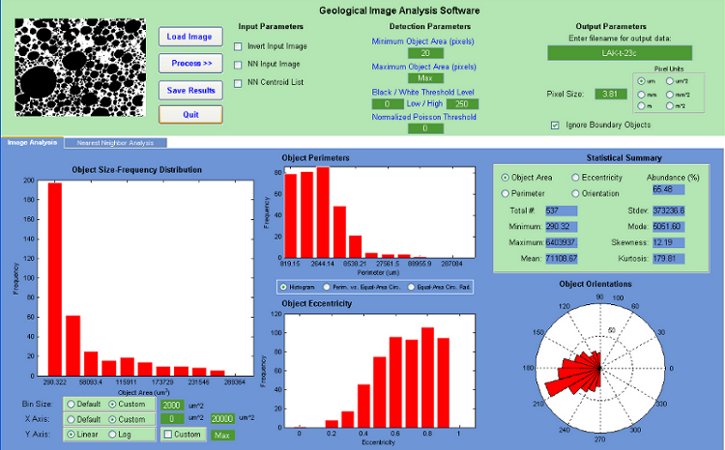
Tab Panel 1: Image Analysis Tab.
The input image is in the top-left corner. The input settings are
controlled by the upper green panel. The lower blue panel shows the
output of the analysis in the form of histograms of the object area
distribution, object perimeter versus that of an equal area circle,
histogram of object eccentricity and a rose diagram of the object
orientations.
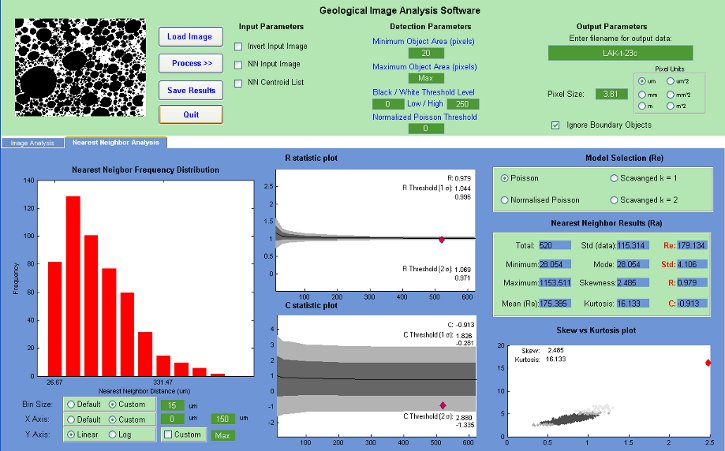
Tab Panel 2: Nearest Neighbor Analysis Tab.
This screenshot shows the analysis of the nearest neighbor distances of
the vesicles. The distances are compared to a Poisson
distribution to test if they are random distributed
or clustered or dispersed in some manner. This can help decide if there
is an underlying process controlling how the vesicles are distributed.
The software allows the changing of parameters to test whether
differing vesicles sizes have different distributions, for example.